Data Visualization
Quantitative Reasoning · Interpretation · Context

A visualization does more than display numbers. Its time frame, comparison group, scale, and visual emphasis all shape the story readers see. This page develops classroom examples for examining those choices critically.

Percentage Change and Absolute Values: The U.S. Dollar and Inflation

The New York Times

The Dollar Has Its Worst Start to a Year Since 1973

It continued to fall even as President Trump retreated from some tariff threats and U.S. stocks recovered.

By the end of June 2025, the U.S. dollar had weakened by more than 10 percent against a basket of major currencies. The article compared this decline with the first six months of every year since 1986, placing the unusually weak start to 2025 in historical context.
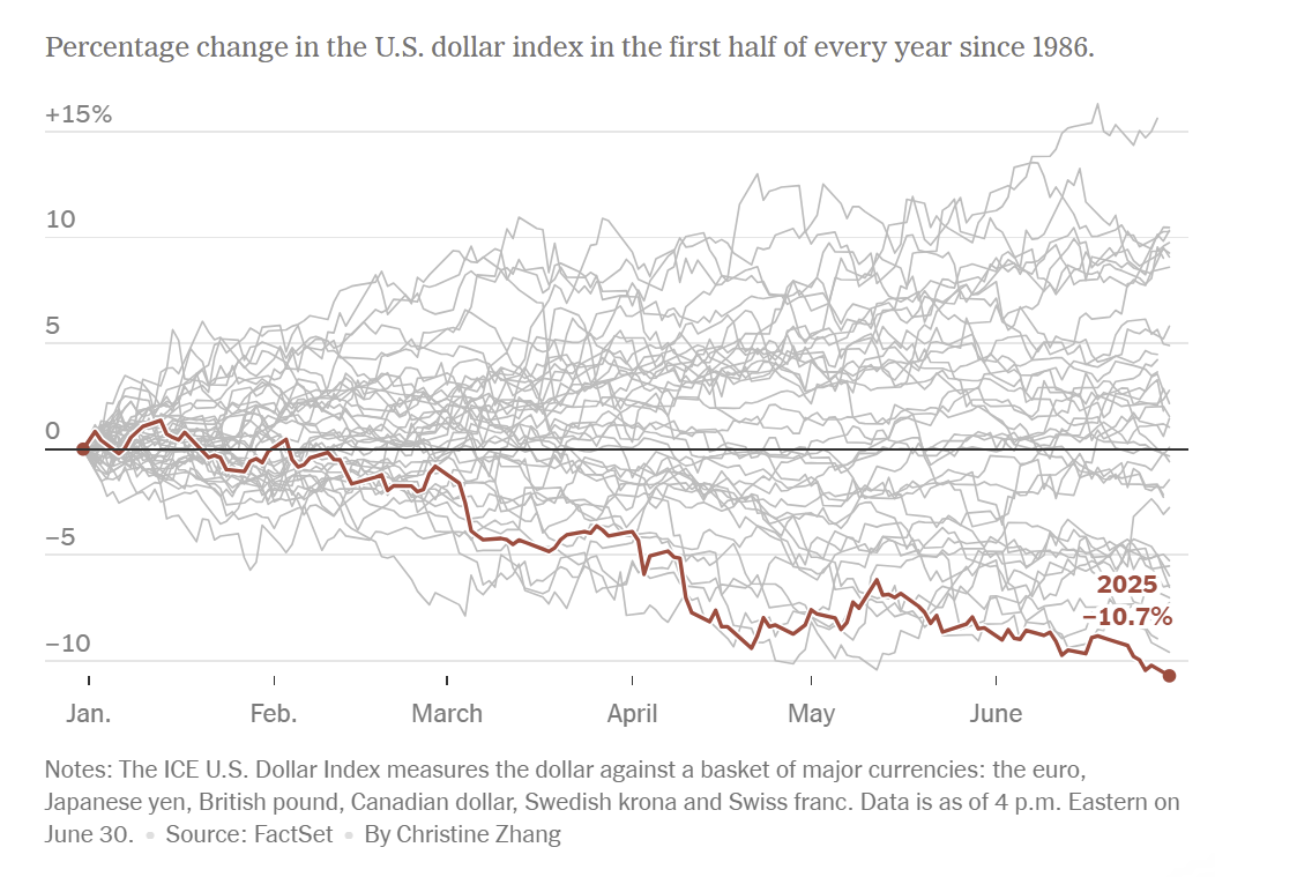
New York Times chart comparing the percentage change in the U.S. Dollar Index during the first half of each year since 1986, with 2025 highlighted.

Source: Joe Rennison, “The Dollar Has Its Worst Start to a Year Since 1973,” The New York Times, June 30, 2025. Visualization by Christine Zhang; data from FactSet. View the original article.

What happens if we extend the same comparison through December?

The original visualization accurately captures the information available on June 30, 2025. Extending every line through the end of the calendar year lets us ask whether an early pattern persisted, reversed, or developed in an unexpected way. Hover over a line below to identify the year, monthly change, and the presidential party in office.

The same data can also be shown as the actual index level.

The chart above resets every year to zero, making the size and direction of each year’s change easy to compare. The chart below keeps the original index values. It asks a different question: not “How far did the dollar move from the beginning of the year?” but “Where was the dollar relative to its longer history?”

The Graph Is Accurate. The Frame Still Matters.

What the 2025 dollar decline teaches us about time, baselines, and quantitative interpretation

Change is not the same as level.

By the end of June, 2025 had the steepest first-half decline in this comparison. But the dollar’s absolute level was neither a historic low nor close to one. Both statements are true; they answer different questions.

Timing is not causation.

Tariffs, government debt, Federal Reserve policy, and presidential statements may all matter. But events occurring at the same time do not establish that one caused the other. Because the index compares the dollar with other currencies, policies and economic conditions outside the United States matter as well.

A weaker dollar is not simply “good” or “bad.”

  • U.S. households: foreign travel and imported goods may become more expensive.
  • U.S. firms and workers: exporters may benefit, while firms relying on imported materials may face higher costs.
  • Savers and borrowers: effects depend on inflation, interest rates, assets, and the currency in which debts are held.
  • Other countries: exporters, consumers, governments, and holders of dollar-denominated debt may experience different gains and losses.

The same standard of evidence should apply whether we support or oppose the administration in office.

Who benefits, who bears the cost, through which mechanisms, and which comparison makes those consequences visible?

Try the Dollar Index assessment.

The quiz asks readers to interpret the three visualizations step by step and reflect on how timeframe, baseline, and additional context affect their conclusions.

Visitors who would like to preview the quiz should enter 0000 for the passcode and 999 for Student ID. Preview responses are excluded from class analysis.

Open QR Quiz