My teaching centers on quantitative reasoning as a practice of interpretation, participation, and critical inquiry. Rather than treating mathematics and statistics as purely technical skills, I help students use numbers, graphs, and data to understand social life, inequality, public information, and human experience.
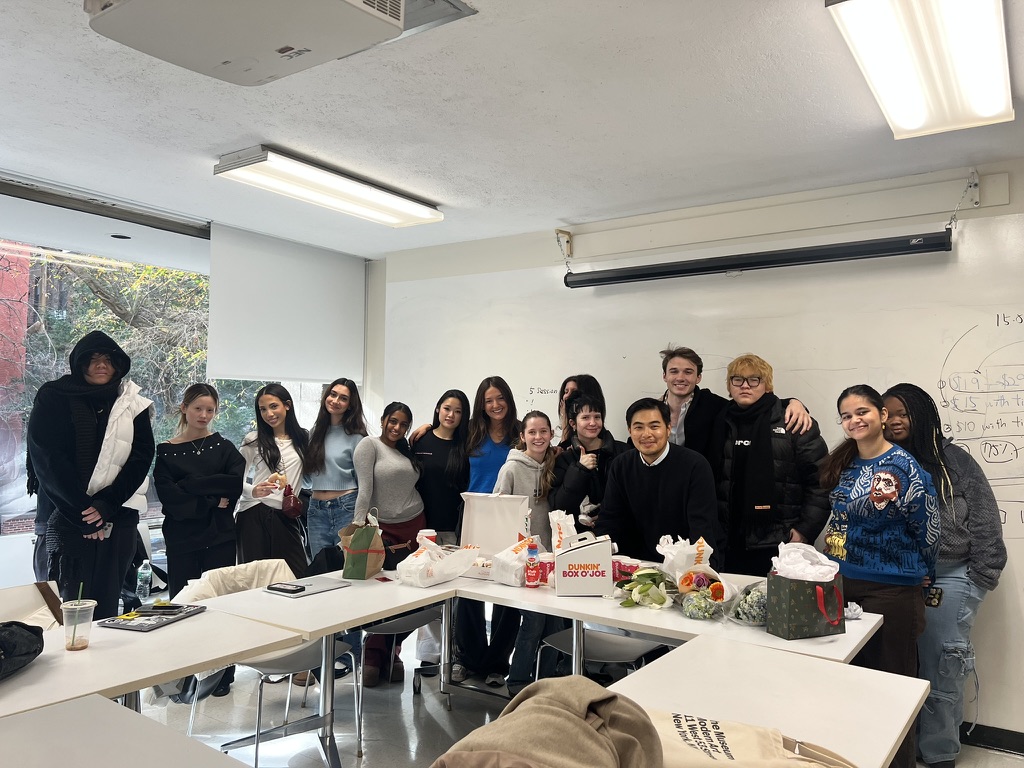
Quantitative Reasoning I & II
Since 2022, I have served as Instructor of Record for Quantitative Reasoning I and II across multiple semesters at The New School, designing and teaching quantitative reasoning courses for interdisciplinary undergraduate students from diverse academic backgrounds.
My teaching evaluations have remained consistently strong across recent semesters. Overall course and instructor ratings have generally ranged between 4.5 and 4.8 out of 5, with students consistently highlighting classroom organization, enthusiasm, thoughtful feedback, psychological safety, and opportunities to connect quantitative reasoning with real-world social issues through collaborative and field-based projects.
Interpretation, Participation, and Critical Inquiry
Throughout these years, I have tried to approach teaching not simply as the transmission of technical knowledge, but as a collaborative process of interpretation, participation, and critical inquiry.
I work to create a participatory classroom environment grounded in psychological safety, where students feel comfortable asking questions, making mistakes, and engaging in open discussion without fear of embarrassment or judgment.
I connect quantitative reasoning and statistics to real-world social issues—including labor, inequality, climate change, minimum wage, public information, and technological change—so that students see numbers not as abstract formulas but as tools for understanding human experiences and social structures.
More broadly, my teaching philosophy is shaped by the belief that education is not only about learning how to calculate, but also about learning how to interpret the world with curiosity, empathy, intellectual honesty, and evidence. I encourage students to ask questions, challenge assumptions, and develop the confidence to use quantitative reasoning as a way of understanding public life rather than simply solving mathematical problems.
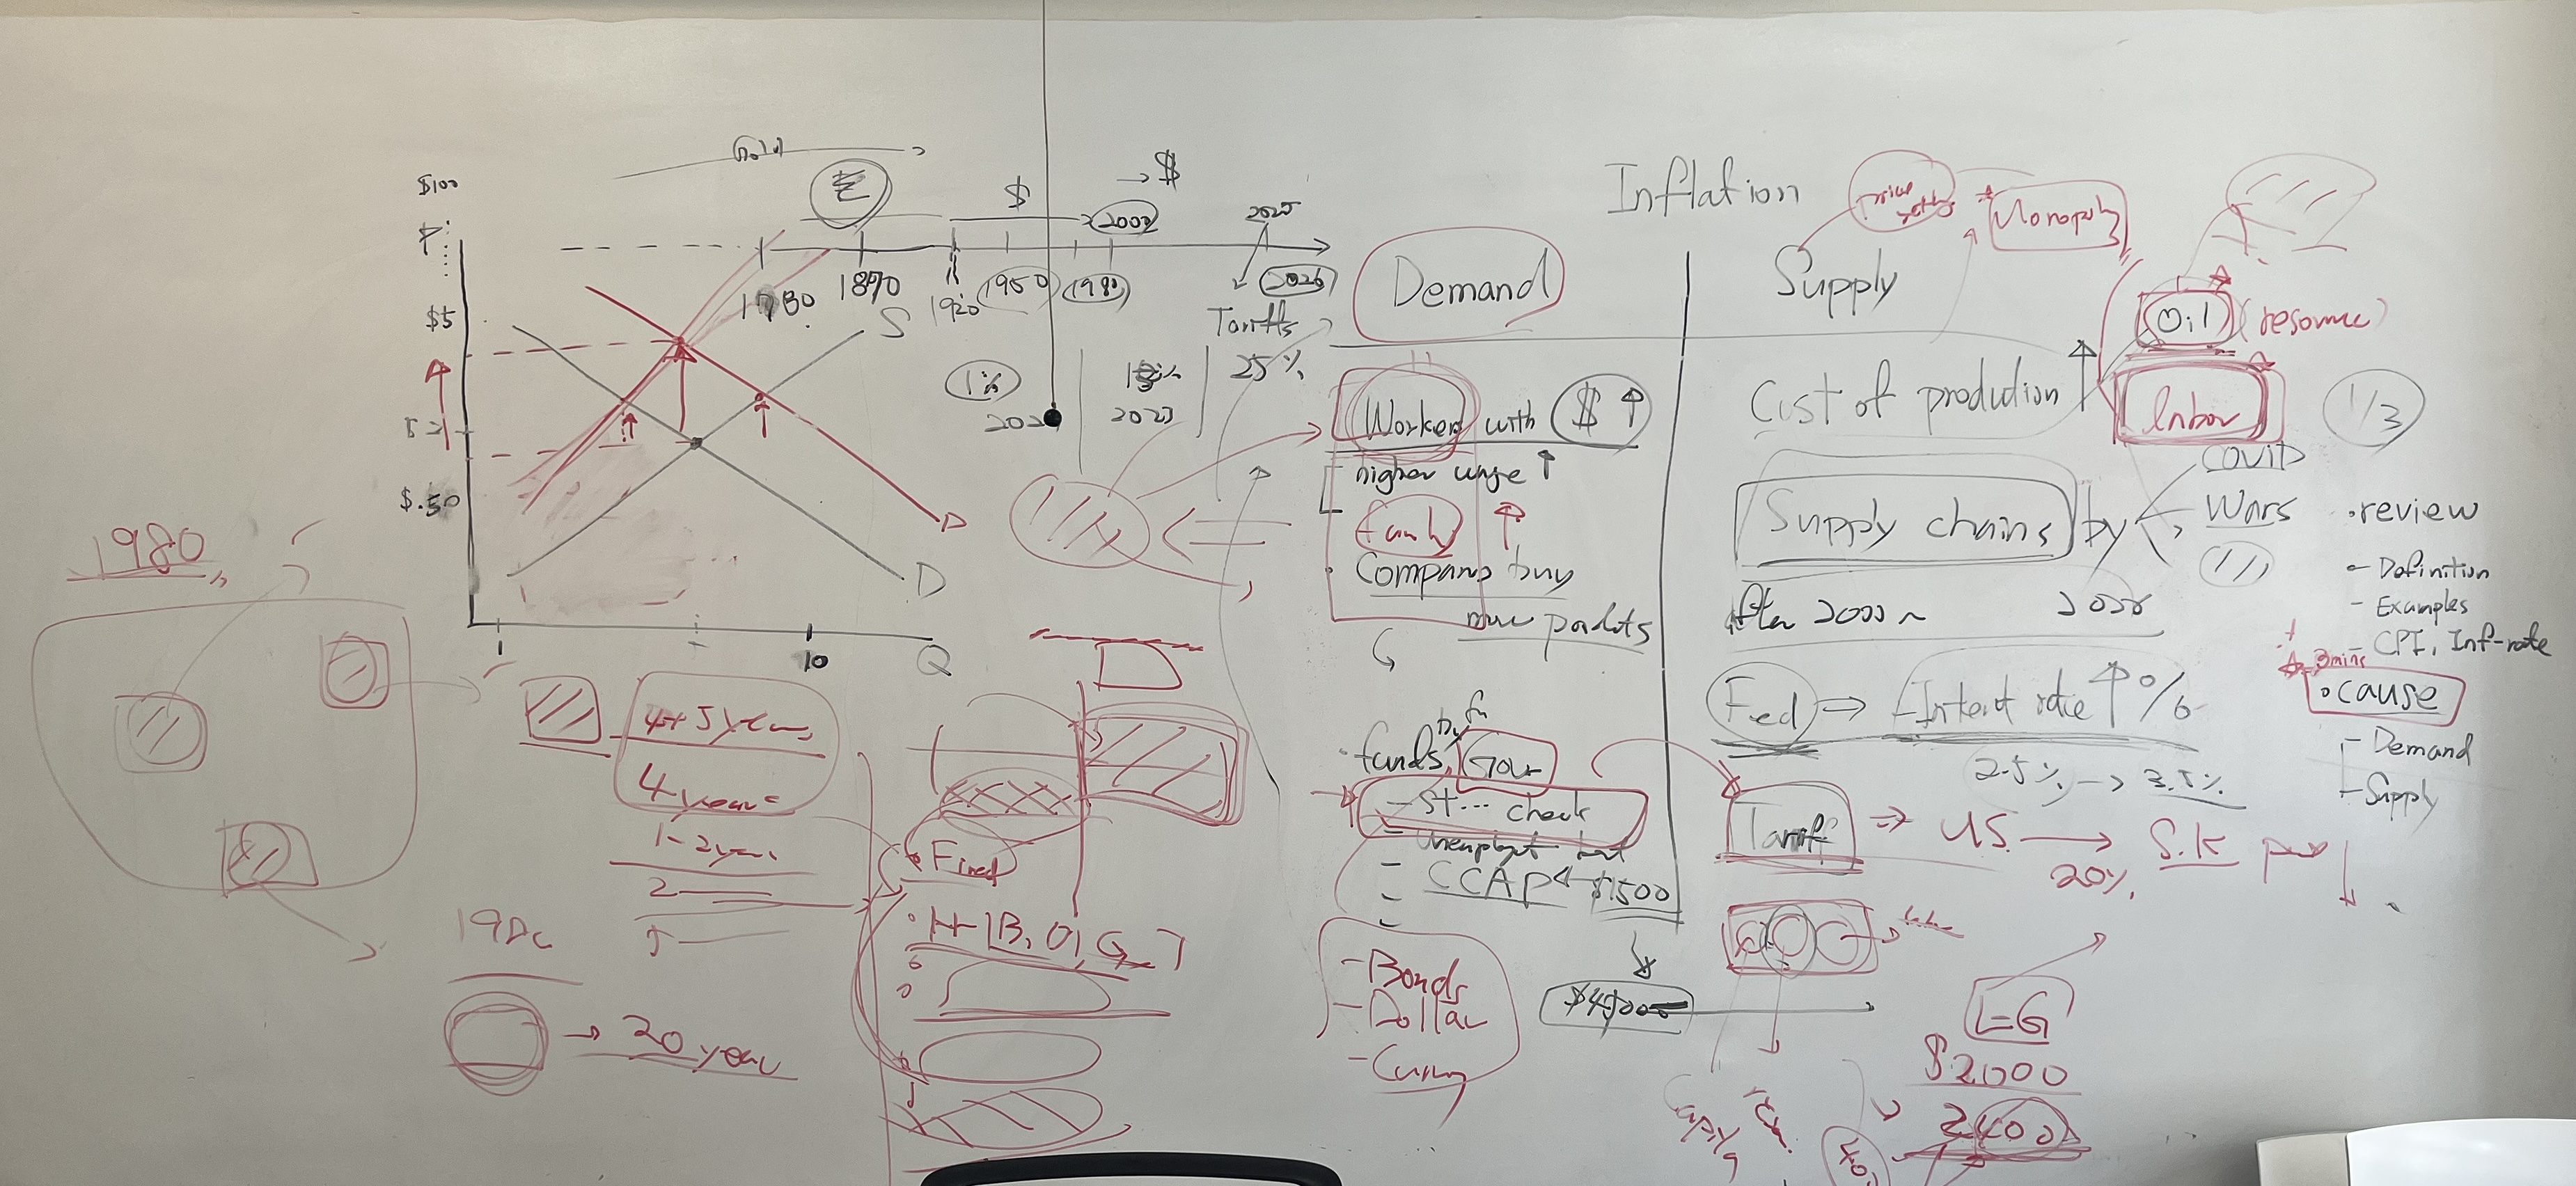
Collaborative whiteboard discussion connecting inflation, labor markets, pricing, inequality, and quantitative interpretation in Quantitative Reasoning.
Field-Based Quantitative Inquiry
In my Quantitative Reasoning courses, students conduct original field-based research projects, collect and clean datasets, interpret visualizations, and connect quantitative reasoning to broader social and economic questions. Rather than working exclusively with pre-packaged datasets, students learn how evidence is generated, interpreted, and communicated through their own observations.
One semester-long project asked students to conduct observational fieldwork across Manhattan retail stores, examining pricing, material composition, production geography, branding, labor conditions, and consumer markets. Students combined their observations into a shared dataset and analyzed the results through descriptive statistics, histograms, boxplots, scatterplots, regression analysis, literature review, and reflective analytical writing.
“A common trend I observed while cleaning the dataset was that items with the highest percentage of polyester fabric were usually produced in countries such as China, Bangladesh, Vietnam, or India, while European and American production appeared more frequently in luxury and boutique stores.”
“Price alone really can’t identify what kind of store something came from. A $200 item at T.J. Maxx and a $200 item at Saks are not the same thing, even if the number is exactly the same.”
“Even the act of collecting data was stratified by store type. Saks was crowded and tightly monitored, while ZARA and T.J. Maxx allowed much freer movement during fieldwork.”
“The trendline is almost flat, and the R² value suggests that price explains virtually none of the variation in cotton composition. This shows that branding, marketing, and symbolic value may matter more than material composition alone.”
“It was one of the best classes for developing creative and logical thinking. The professor encouraged students not to passively follow instructions, but to think for themselves and solve problems on their own.”
“This course changed the way I think about math and data. I came in mainly wanting to fulfill a requirement, and I’m leaving with a real interest in quantitative reasoning and how it can be used to understand the world more critically.”
“Hoyeon is passionate about what he’s teaching and pushed me to keep going when I thought I couldn’t. He is a very thoughtful professor.”
“Professor Lee is the best math professor I have ever had. He is extremely clear in his explanations and always takes the time to show not just how to do something, but why it works.”
“The way we progressed from basic concepts to Excel, data visualization, and then full projects made the mathematics feel practical rather than abstract.”
“Group projects gave us the opportunity to work on large-scale and real-world projects.”
“Working with topics such as plastic waste, sweatshops, minimum wage, inflation, and data misinterpretation helped me see how quantitative reasoning shows up in the news and in everyday decisions.”
“Professor Lee is very knowledgeable and did a good job explaining data visualization concepts.”
“His enthusiasm for the class made the environment a space where I felt comfortable asking questions and truly understand difficult concepts.”
“The assignments and files were really organized and easy to find in Canvas.”
“Because of Hoyeon, I can understand the importance of statistical data and analysis and how to use it in my profession.”